The Great Convergence: How Observability and Data Platforms Are Colliding
RYZE recently presented at Dynatrace Perform on applying a Medallion architecture to business analytical data captured through an observability platform and how to navigate the conversations with your data platform team about where that data should live. If you're interested in the tactical side, start there. This is intended as a companion piece for a higher level perspective.
The overlap is real and growing
Data platforms moved from SQL based warehouses to flexible lakehouses with read on schema file stores as they worked to overcome scaling and cost limitations by introducing technologies such as Hadoop, Apache Iceberg in the advent of hyperscalers and cheap cloud storage . Meanwhile observability tools evolved from basic metrics to "searchable logs”, to traces and eventually ran into scaling issues after the Microservices and Serverless boom. As Data platform tools evolved to offer Data Lakes and now Lakehouse architecture, unstructured data like application logs could be ingested at a larger scale and queried alongside structured business data. Meanwhile, Observability platforms responded to the scaling wall by investing in more powerful storage engines, richer query capabilities, and analytical UX — whether that meant building lakehouses, adopting columnar OLAP databases, decoupling storage from compute, or rethinking what data to store in the first place.
As enterprises become fully digitized, Enterprise Applications are effectively “your business”, just as if your factory went down, if your systems go down - your business goes down. Consequently, stakeholders ask increasingly technical questions: what's the error rate, how is performance impacting revenue? Tech teams ask business questions: which business function does this degradation impact, so I can prioritize?
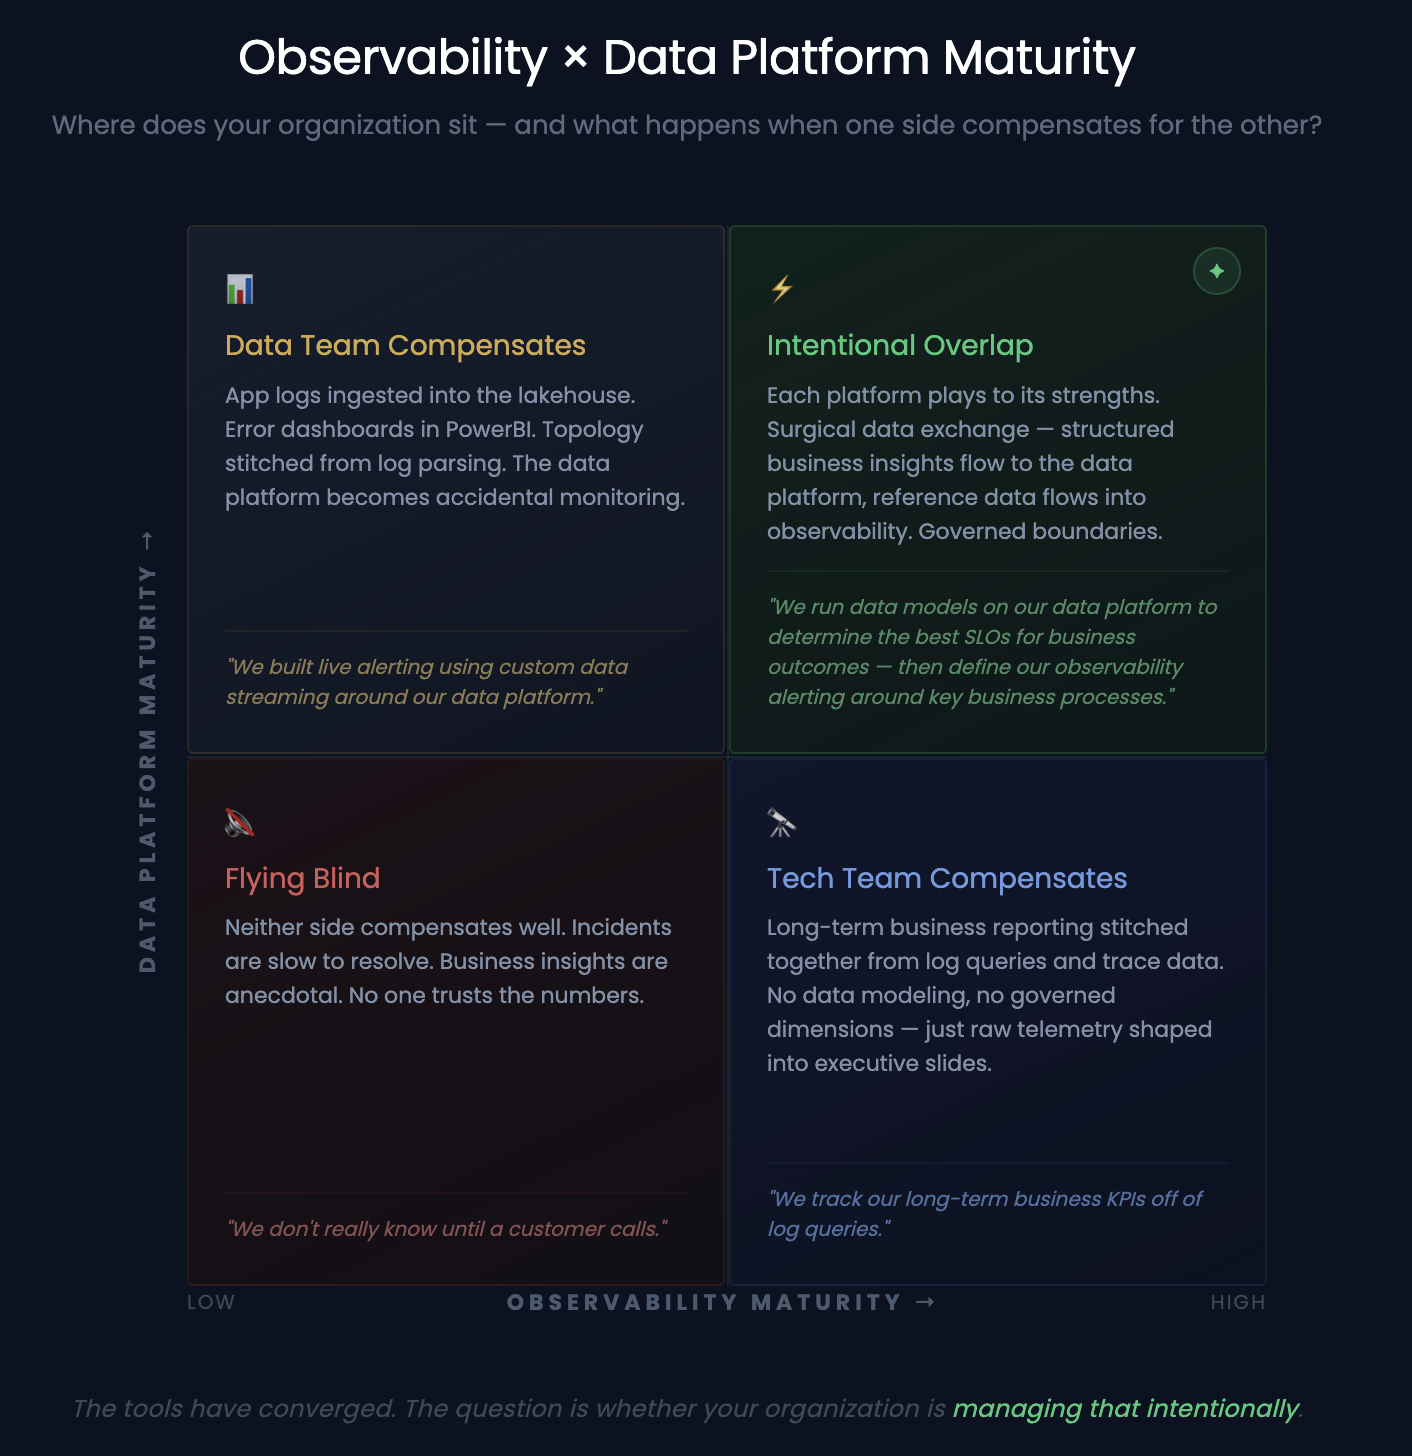
You may already be feeling this. Tech teams offering critical business insights out of observability platforms. Or the opposite, Data teams ingesting application telemetry into the lakehouse. The growing hunger for insights out of Enterprise technology along with the rapidly advancing technologies in both spaces have started to break down the silos between these two spaces.
Left unmanaged, this creates real problems
You may end up with similar or the same type of reporting out of both systems, depending on the overlap. For example, if your data practice is less mature, tech teams compensate to answer business analysis with observability tools. Dashboards from logs, business metrics from traces, process reporting from telemetry — within IT context, this is fine. Understanding business impact is part of modern observability. The red flag is when that data gets exported to Excel and lands on executive slides because there's no other place to get it. That's not a tech team adding context — that's an observability platform becoming the business's source of truth by default.
Flipping the script, If your observability practice is weak, data teams compensate. App logs in Snowflake or Databricks. Error dashboards in the lakehouse or on a PowerBI dashboard. Topology stitched together from log data.
Both technically work. But you may be chasing your tail reconciling numbers between the two platforms, or over engineering and pushing a tool beyond its limits to answer questions the other should. For example, trying to track and alert on a performance drop for an application is not a simple endeavor on a traditional Data Lakehouse platform, similarly trying to do simple regression on key business outcomes, while possible, is a stretch in Observability tools.
This leads to confusion over the source of truth, contradictory dashboards, and duplicated effort. At worst, it leads to over-engineering: building observability inside the lakehouse or building analytics inside the observability platform.
Maximize Strengths
One key point is to consider your observability platform is a context-rich analytical store for your IT operations. Often with just agent instrumentation, you get live data automatically enriched with infrastructure context, a log stamped with the exact host, process, container, and service that produced it, linked to upstream and downstream dependencies, with a topology map of your entire IT estate generated automatically. Your enterprise data platform is a context-rich analytical store for your business operations. Historical data assets, reference tables, customer records, financial data, the ability to join any entity against any other across the organization. That context was curated over years.
If you maximise the capabilities of both platforms, you will see some overlap, and that’s okay. For example, you may report on business flows and alert on them out of your Observability tool, or correlate certain outages with financial data using your Data platform to build more meaningful SLO’s.
Both systems should play into each other. The aforementioned presentation gives an example of when it might be appropriate and at what point to move data straight out of your Observability platform into your Data platform. Hint: It’s not blindly copying over every log, trace, metric into a data pipeline. No need to rebuild an observability tool. Conversely, you may need some business reference data in your Observability tool - like mapping locations for a geo visualization or a lookup for broader categories like Aircraft types.
These aren't one-time decisions. They require your observability and data organizations to continuously evaluate where work should live — and your business stakeholders to be part of that conversation. The tools have converged. The question is whether your organization is managing that intentionally.